home
- installation
- data
preprocessing and editing
- data review
and visualization - statistics and extended data analysis
- user
interface reference
Customizing raw data
display
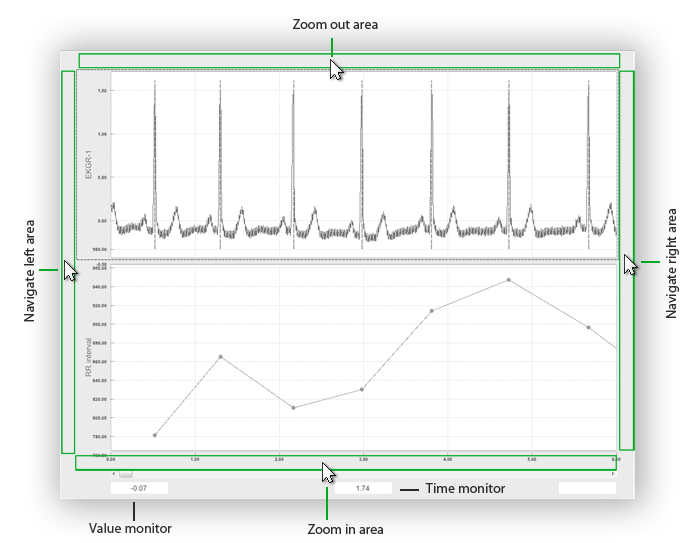
Raw data display (low number of channels)
Raw data of only a few signals is displayed in seperately selectable
axes, as shown for ECG and its associated IBI trace below. You can
navigate the available data either by using the scrollbar on the bottom
part of the window and zoom in using the mouse wheel. Or you can click
right, left, above and below the axes area to navigate right, navigate
left, zoom out and zoom in respectively. The white boxes below the time
scrollbar indicate value and time points at the mouse position of the
currently selected signal.
You can also zoom and navigate using the mouse wheel: moving the
mouse wheel forward will zoom in on the current position of the mouse,
the other direction will zoom out on this position.
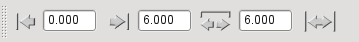
You can set the window limits and size manually or read their values
from the time toolbar, which shows left limit, right limit and window
size in seconds. On the far right is the "show total interval" button,
which will zoom out to a maximum to display all available data.