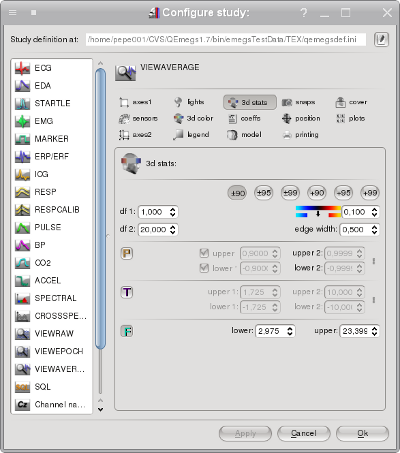
Statistical coloring is configure on the 3d stats page of the VIEWAVERAGE
section of the "configure-study"-dialog.
Similar options are available from the context menu opened on the mapper docking window.
The three statistical coloring modes (P value mapping, T value mapping and F value mapping) translate the
signal values to colors based on the amplitude ranges defined by the
"lower/upper" spin controls of each mode. In contrast to the standard
coloring modes, they are independant of amplitude settings on the navigator dock widget. Values
outside these ranges are left in the general render model surface
color, making significant areas pop out. A user sizable central
part of the selected colormap is ignored as defined by the cover color range spin control.
Values near the limits of the defined ranges are blended from
statistical color to model surface color. The size of this transition
range is configure using the edge
width spin control.
By setting the degrees of freedom and the desired p-values, you can
obtain corresponding T- and F-values for the upper and lower limits of
the color scale in the T-color and F-color controls.
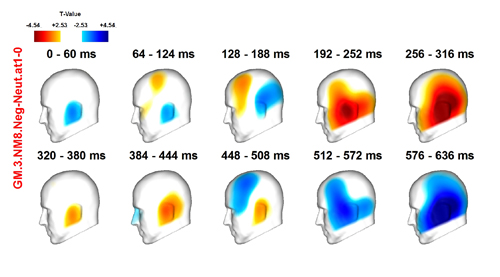
Example of T-coloring:
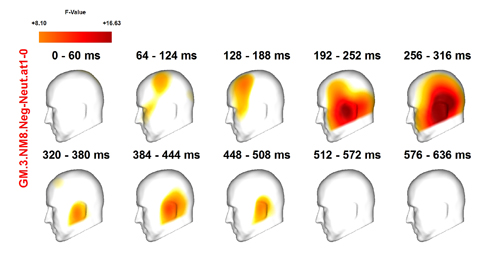
Example of F-coloring: