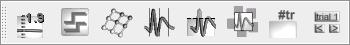
Most important features of 2d graphs can be activated/deactivated
using the 2d format ...
(Data, Lgend, Global power, Axis
frame, Axis background, Axis grid, Baseline interval, X-Ticks, Y-Ticks,
X-Tick-Labels, Y-Tick-Labels, Triggerpoint, Cursorpoint, Sensor name,
Dataset name)
and 2d format extended
(Cursor labels, Interval mean
(step functions), Sensor groups, Intervals, Data clipping, Sensor group
axes, Number of trials, Trial selector)
toolbars.
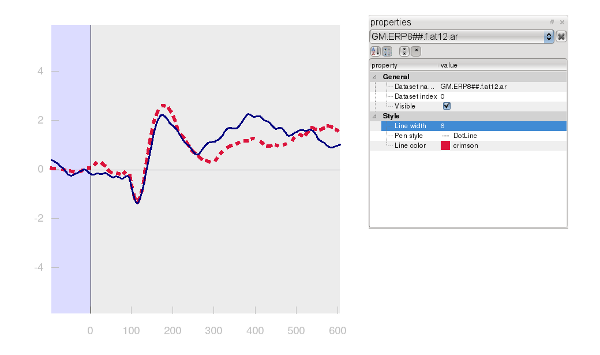
Colors and linestyles of the data signals can be configured in more detail on the properties docking window:
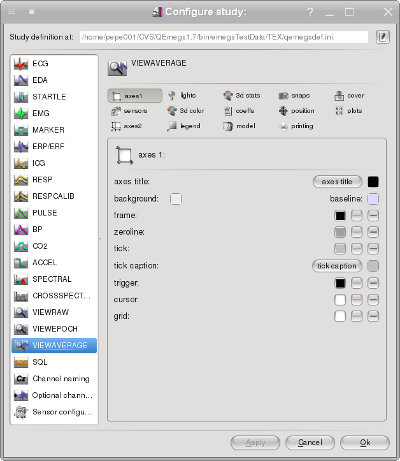
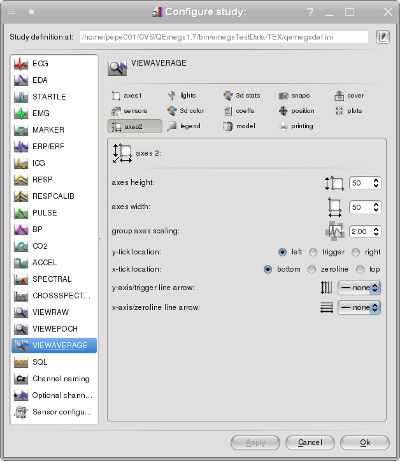
The font, color and type of axes elements (ticks, axes lines, title,
background, baseline interval, frame, etc....) can be set on the axes 1 and axes 2 pages in the VIEWAVERAGE section of the configure-study dialog: