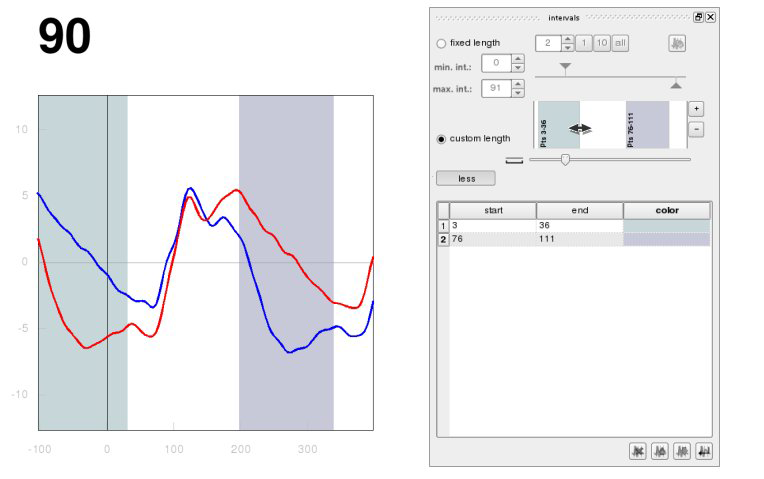

Intervals can be loaded, saved, moved and resized using
the intervals docking
window. In the custom length
mode, the area graph on the docking
widget allows dragging operations with the mouse, the spreadsheet below
can
be used for parametric input and interval colour selection. The
interval currently displayed in the mapper
docking window can be selected with the slider below the area
graph. While the mapper is active, timing controls other this slided
are disabled, as the 3d display is based on the selected intervals.
Deactivate the mapper to change the interval settings.
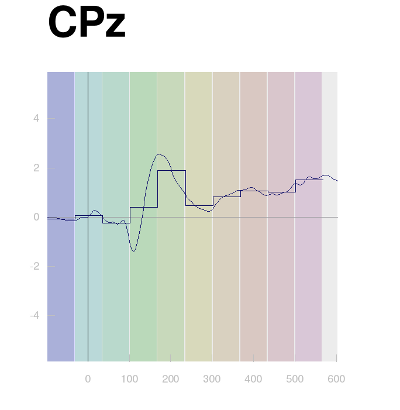
Intervals can be highlighted on 2d graphs using the intervals toolbutton on the format 2d extended toolbar:
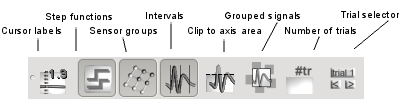
Moreover, interval averages can be displayed as step fuctions using the Step button on the format 2d extended toolbar. These interval averages are used for 3d plotting (!).