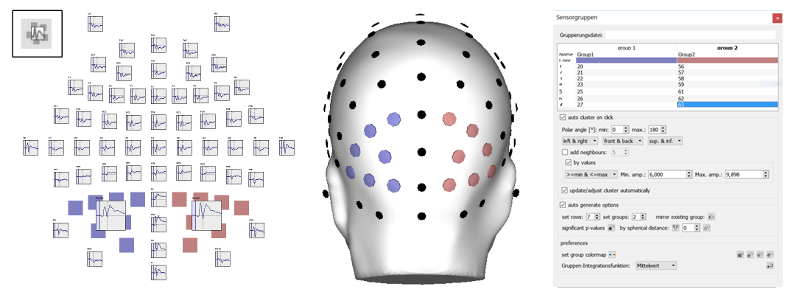

Custom sensor groups can be loaded, edited and highlighted on 2d
and 3d graphs using the sensor
groups
docking window. To modify a sensor group, click in the
corresponding
column on the channel group docking window, then hold SHIFT
pressed and
click on a sensor axis or 3d sensor marker to add/remove this
sensor
to/from the selected
group. Click in the "Color" row cells to change the color of a
specific
sensor group. Click the "Name" row cells to change the name of the
sensor group, that will be displayed as axis title and that will
be
used as factorial gradation name when calculating an ANOVA with a
sensor group factor.
You can quickly configure EMEGS with all the settings necessary
to easily configure and adjust your sensor groups by selecting "\View\Desktop
layout\Sensor grouping" from the menu or by using the
keyboard shortcut Ctrl+X.
 load groups from a textfile
 save the current sensor group
table
in a textfile
save the current sensor group
table
in a textfile
![]() clears the sensor group
table
clears the sensor group
table
 apply the current sensor
group
table
apply the current sensor
group
table
 starts automatic creation
of
sensor groups with the given spherical angle, the given number of
sensors per group or or the number of total groups - whichever
parameter was last set. Sensor groups are optimized for minimum
spatial
spread.
starts automatic creation
of
sensor groups with the given spherical angle, the given number of
sensors per group or or the number of total groups - whichever
parameter was last set. Sensor groups are optimized for minimum
spatial
spread.
 flip sensor group along
a
given dimension
flip sensor group along
a
given dimension
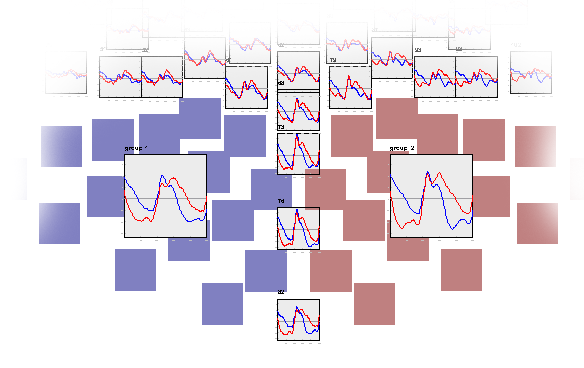
 activates the display of grouped
axes
activates the display of grouped
axes
Signals averaged across sensors in a group can be
displayed using the group axes
tool button. The group signal integration function (Global Power,
Root
Mean Square or Mean) can be selected using the dropdown menu on
the
sensor groups docking window. Grouped sensor 3d markers can be
scaled
for better
visibility using the "grouped sensor scaling" spinbox on the
sensors-tab of the options browser.