Command: Plugtfgui.
This plugin allows to display the results of the fieldtrip time/frequency analysis, and to export data into a text file. To use this plugin, you must have the MAT files from plugtfwltgui.
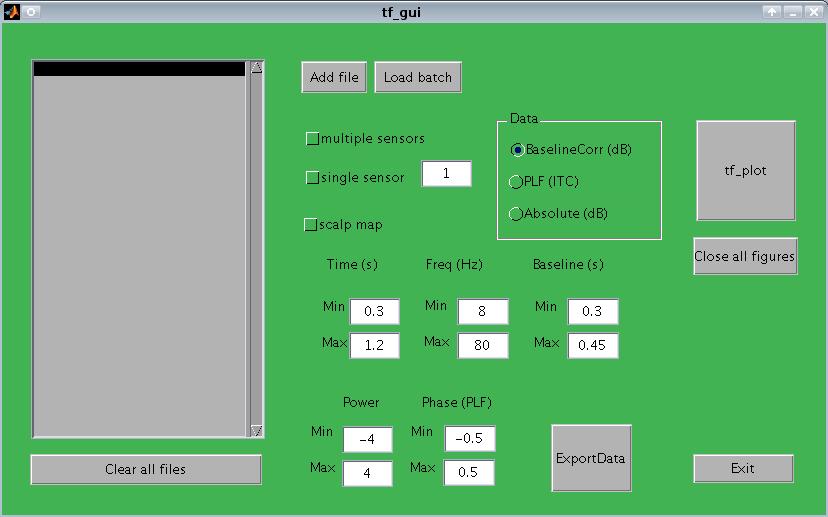
This interface allows to plot and to export the results of a time-frequency analysis done using the fieldtrip plugin for emegs.
Loading files to visualize
On the left, there is a large gray panel which contains the files which will be plotted. You can manually add files to this list by selecting 'add file', and clear the list by selecting 'clear all files' (bottom of the file list).
When searching files, the start path will be matlab current directory. Change it to use a different start folder.
If you have a batch file containing a list of all the files which you want to load into the file list panel, you can load it by selecting 'load batch'.
Choosing type of visualization
This plugin offers three types of data visualization: multiple sensor plot, single sensor plot, or scalp map. Select the one(s) you wish, and switch from one to the other to get confidence with your data.
Choosing type of data to visualize
This plugin allows to visualize raw data (with no baseline correction), baseline-corrected data, or phase-locking factor data.
Power data are always expressed in dB. dB are calculated as 10*log10( uV^2).
Choosing time, frequency and baseline
In the time and frequency text boxes, indicate the boundaries of the data of interest.
In the baseline text boxes, define the temporal boundaries of the data which will be used as baseline.
Important: time intervals are expressed in seconds, relative to the beginning of the epoch. Therefore, 0 = beginning of the epoch.
Choosing color scale
In the power and phase text boxes (middle bottom) you can select the dB and PLF limits of the color scale of the plot. Depending on which type of data you want to plot (power or phase-locking factor), adjust the scale you want.
Done!
When done, press tf_plot to visualize your data. One window will be opened for each file and for type of plot selected.
When the number of windows gets too high, click 'Close all figures' to close all plots and keep the main window open.
Exporting data
After having visualized your data, and identified the time and frequency intervals of interest, you may want to export your data in a convenient text format to be imported in a statistical program.
This plugin allows to export one time/frequency interval of interest at a time, so if you have more than one effect of interest (e.g., alpha decrease and gamma increase) you'll need to create multiple text files.
To export some example data, e.g. alpha (8-12Hz) in the 0.3-0.7seconds from the beginning of the epoch, you must perform these three steps.
First, create a batch file containing the list of all files to be exported. Typically, this list will include files from different participants. Save it as a text file.
Second, enter in the appropriate text boxes the frequency and time boundaries, and the baseline to be used.
Third, press ExportData. The program will ask you for the batchfile, and for a filename for the exported file.
Format of the exported data
The plugin exports data as a text file organized by columns. Each column will contain a different type of information.
Data. In the last three columns (rightmost), the plugin exports the average of the selected time/frequency interval, as absolute data, baseline-corrected data, and phase-locking factor.
Sensors. Before the first data column, the program exports the sensor number. All sensor data are exported, and you can manually delete data from unwanted sensors later.
Other information. Often, filenames contain important information about the content of the data: participant name, condition, etc. For each filename, the program looks for all numbers and saves numbers as different columns. For instance, the filename '/home/andrea/exp1/cond1/part1/data.mat' will be exported as 1 1 1.
At the beginning of the file, a small header is written giving information about the settings used to export the file. Example:
15-Apr-2010
batchfile: /home/andrea/studies/myexperiment/batchfile.txt
foi: 8 to 80;
toi: 0.31 to 1.2
baseline: 0.32 to 0.45
columns are : 5 heading columns, sensors, absolute data, baseline-corrected data, PLF