Commands: EditAEM, CalcAutoEditMat,
CalcAutoEditMEGMat, FindBadChan, FindBadChanTrial, emegs2d
Contents:
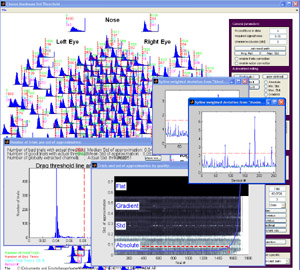
Statistical artefact detection: The main
interface of EMEGS responsible for statistical artifact detection is EditAEM, which you can see in the figure
1 below. It works on the bases of statistical parameters, that
have to be calculated for every channel in every trial before using
EditAEM. These parameters usually include the maximum absolute
amplitude and standard deviation of the signal. They can be calculated
in batch mode using PrePro (see section 'segmentation and
filtering...') or by running the script 'CalcAutoEditMat' (for EEG
data) / 'CalcAutoEditMEGMat' (for MEG data) and by default are stored
in the *.AEM / *.TVM and *.AEM.AR /*.TVM.AR -files.
The function of EditAEM is to allow the user to interactively set the threshold that separates 'good' from 'bad' data. This can be done quickly in a mostly automatized fashion, but also manually for every sensor and threshold type. Generally speaking, EditAEM works by setting 3 types of thresholds. The default procedure is to let EMEGS set the first and third threshold and let the user set the second one. This is because the first and third threshold type include multiple decisions, which, with a high number of channels and trials, quickly become quite laborious. The threshold types are the following:
All three threshold types can be seen in figure 1 and will be
explained separately:
type 1
thresholds: type
1 threshold can be seen in the two windows titled ' spline weighted
deviation from ...'. Both show a channel overview (channel number on
the x-axis, average parameter value (across trials) on the
y-axis),
one for the parameter 'maximum absolute ampitude', the other for the
'standard deviation'. The green horizontal line illustrates the mean of
all channels, the red line illustrates the threshold level. Thus, all
channels above the red line are globally extracted. You can influence
this threshold by changing the 'channel exclusion'-value in the
EditAEM-menu.The given value is interpreted as absolute distance in
standard deviations from the overall mean, thus a value of 2.5 would
mean, that all channels, that differ from the overall mean by more than
2.5 standard deviations, are excluded from further analysis.
type 3 thresholds: the blue bar graphs in figure 1 are trial histogram plots for a chosen parameter ('maximum absolute amplitude' in this example). In each plot there is a dashed red line, that corresponds the type 3 threshold, that EMEGS set automatically for each channel. In cases where there is no line visible, all trials for that sensor were rejected, which can also be seen from the green '0' above the bar plot (the green number corresponds the number of good trials, the red number corresponds the number of bad trials, the cyan number is the good/total ratio, the pink number is the channel number). You can influence this threshold by changing the 'required signal/noise'-value in the EditAEM-menu. This value does not have such a straight forward meaning as the 'channel exclusion'-value. It is used as an exponent, thus changing it towards 1 will half stronger consequences than lowering it towards 0 by the same amount. A higher value will results in more conservative thresholds, therefore it can be useful to think of it as the amount of signal/noise that you require in your data. As a start you might use 0.2, higher values (e.g. > 0.25 ) would mean, that you only accept high quality data with high signal and little unusual events (noise), low values (e.g. < 0.08 ) would mean, that you also accept data with a larger amount of variation in it, possibly including artifacts. But remember, this is only meant as a help for understanding the general function of this value. Its true meaning is described in detail in the SCADS-paper below.
type 2
threshold: the one type 2 threshold is set using
the windows titled 'Number of trials per std of approximation' and
'Trials and std of approximation by quality'. The latter one
shows a graphical display of the sorted 'AutoEditMat', the matrix that
contains the parameter values for every channel and trial (with a high
number of channels and trials, not all channels are displayed, but
averaged channel groups, e.g. channel 1:5, channel 6:10 etc). It is
sorted by quality, so that the best trials are columns on the left, the
worst trials are columns on the right. If forms the greyish background
of the window and is subdivided in 4 rows, one for each parameter in
the AutoEditMat: the 'maximum absolute amplitude', the 'standard
deviation', the 'maximum absolute gradient' and the 'flat'-value. The
red line again is the threshold line. The foreground blue line
shows the 'std-of-approximation'-index for every trial on the x-axis.
This index codes the data quality of a trial, using the information of
the AutoEditMat and the positioning information of good and bad
sensors, to estimate how reliably bad sensors can be approximated by
surrounding good sensors. Thus, if missing sensors are all clustered
together, the index will be higher (the quality is worse) than if the
same number of bad sensors are evenly distributed (see the section on
the trial quality index below). Please note that the
y-axis of this line has nothing to do with the
y-axis of the matrixplot in the background. Both displays share only
the x-axis (the trial number) and are overlayed only to focus the
information on one window. The fact that the blue line is monotonically
increasing is due to the fact that, as mentioned above, the
AutoEditMat is sorted by trial quality. The window titled ' Number of
trials per std of approximation' now is simply a histogram plot of this
index. Therefore, the vertical threshold line in the histogram plot
corresponds a horizontal threshold in the AutoEditMat-window. The
horizontal and vertical threshold lines in the AutoEditMat-window are
linked, thus if one of them is dragged, the other one will follow to
keep the crosssing on the blue line. For both windows, trials on the
left of the threshold line are accepted (good trials), trials on the
right are excluded (bad trials).
The automatized editing process
If you want
to use the standard editing procedure (that is to have EMEGS set the
type 1 and type 3 thresholds for you, and set the type 2 threshold
manually), push the
'Fast Auto 2'-button. It uses two parameters: the
maximum absolute amplitude, and the standard deviation. This is
sufficient for most cases. You are then asked to select
*.AEM*-files manually or in form a batchfile. When done with the
*.AEM*-files, you can also supply *est*-files (by mouse or as
batchfile) for every *.AEM*-file given. Choose cancel when you're
finished with that, and wait for EditAEM to display the
parameterhistograms and one channeloverview for each parameter used and
to set the corresponding thresholds (dashed red lines). For FastAuto1,
the histograms will be updated twice and two channeloverview windows
will appear. Based on these thresholds, EditAEM calculates the
'std-of-approximation'-index for every trial, showing you the progress
in a separate window. When done, the two graphs titled 'Number of
trials per std of approximation' and
'Trials and std of approximation by
quality' will be displayed. EditAEM
now sets a default type 2 threshold in order to give you a valid
initial configuration and quickly displays the 3 worst trials for this
default threshold as
simplified channel status plot (green numbers indicating good sensors,
red numbers indicating bad sensors, to give you an quick impression of
the of the data quality you will have with this threshold). After that
EditAEM waits for you to adjust the threshold according to your wishes.
To do this, drag the threshold line on either of the two latter
windows (their lines are linked) to a position of you choice
using the mouse. When releasing the mouse button, EditAEM displays the
3 worst trials for the chosen threshold as simplified channel status
plot (green numbers indicating good sensors, red numbers indicating bad
sensors), to give you an quick impression of the of the data quality
you will have after the editing. EditAEM also displays the number of
trials that will be accepted as good (green number at the top of
the 'Number of trials per std of approximation'-figure) and the number
of trials that will be considered as bad (red number below).
When you think you have chosen the optimal threshold, click the
'accept'-button.Then EditAEM closes the editing windows and saves your
thresholds to disk, creating a *.WE*-file and a *.TVM*-file that
contains
information from all 3 threshold types . These files can then be used
as input
for EmegsAVG, which is the tool in EMEGS to average across 'good'
trials while interpolating 'bad' sensors by surrounding ones.
Moreover, another graph will be displayed showing accepted (green *s)
and rejected (red *s) trials in their temporal succession in the
presentation. If you are editing in batchmode, EditAEM will then close
all the supplementary graphs and jump to the next file. If you are
editing file by file manually, you can either load the next data file,
close the figures manually or select the 'All' or the 'all expect main'
item, from the 'close specific'-dropdownmenu. If you select 'All &
EmegsAVG', EditAEM will be closed, EmegsAVG will be started and the
edited files will automatically be loaded for averaging.
Diplaying data trials from the AutoEditMat-window
With the considerably abstract diplay of the
stastical parameters as a grayscaled surface, it is often hard to judge
where good trials end and bad trials begin. One thing to help in this
decision it to take a look at the overal shape of the
AutoEditMat-display: Light color values represent larg parameter
values, darker colors small parameter values. For 'maximum absolute
amplitude' and 'standard deviation', unusually large values are mostly
caused by artifacts, so that in general, as the AutoEditMat-display is
sorted by quality, the surface should become increasingly bright from
left to right. The entirely white bars on the right represent trials,
that emegs has already extracted due to type 1 and 3 thresholds. They
cannot be included in the averaging by selecting a high type 2
threshold. The only way include them anyway, is to alter the settings
for the automatized thresholds before initiating the 'AutoEdit'. In
most cases, however, you will not want to use those trials, as they
contain mostly blinks, head movements and other severe distortions of
the signal. However, quite often you can identify a position in the
AutoEditMat, where a qualitative change takes place, for instance,
where a cluster or bar of bright spots starts, that cannot be found in
trials on its left. This suggests, that all trials with this bar are
somehow different from most of the other trials, and chances are that
they contain artifacts.
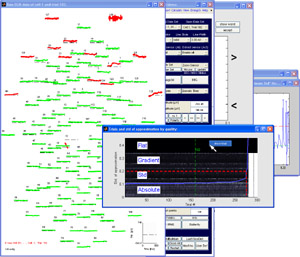 |
| figure 2: displaying single
trials of the AutoEditMat |
Another helpful tool for identifying the right threshold position,
is to look at the trial rawdata itselft. To do this, rightclick
over a desired position on the AutoEditMat-graph and select 'show
trial'. EditAEM will open the emegs2d-console, load the
datafile, select the corresponding trial and colorize good and bad
sensors in green and red. If you do this for a trial on the far left
and a trial on the far right of the AutoEditMat, you should see large
differences. Explore trials near your threshold location to get an idea
of what kind of data you would be accepting/rejecting.
Editing modes:
| mode |
fast
auto 1 |
fast
auto 2 |
fast
auto 3 |
fast auto 4 | fast auto 5 | custom |
| behavior | ? |
this is the
mode you should
choose for standard ERP/ERF designs |
? |
? | ? | ? |
| parameters
used |
? | maximum
absolute amplitude standard deviation |
? |
? | ? | ? |
Recommended settings: the default
values in EditAEM are
optimized for a 129-channel-setup. The following table gives you
suggestions how to modify these settings for different system:
| setup |
32
channel EEG |
64
channel EEG |
129
channel EEG |
256
channel EEG |
145
channel MEG |
280
channel MEG |
| Std.
Exponent [goal function] |
? |
? |
0.25 |
0.15 |
? |
? |
| channel
exclusion [std] |
? |
? |
2 | 3 |
? |
? |
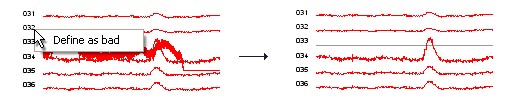
manual artefact detection: Support for manual
artefact detection outside EditAEM is limited in emegs. You can
however globally exclude channels using the continous data display in
emegs2d (only for EGI data at the present point). To do this, open
emegs2d, select Egis Continuous as data format, and load your data
file, you can then rightclick on channel numbers/names and select
define as bad to exclude the channel for further processing (see
example below). Please note, that this works only when used with
PrePro. For manual script-based preprocessing, call AddDefinedBadChan to integrate the
continuous electrode status file (*.*cest) with the standard electrode
status file (*.*est).